In this post, we will analyze AXA’s stock chart to derive actionable trading strategies based on technical indicators such as Bollinger Bands, local maxima and minima, and trendlines. These tools help identify optimal entry and exit points for both short-term and long-term trading strategies. By understanding the dynamics of the chart, traders can navigate buy and sell zones with greater confidence.
The analysis divides strategies into:
- Short-term trades using Bollinger Bands for quick buy/sell signals.
- Mid/long-term trades using trendlines for more gradual entry/exit points.
Chart Breakdown
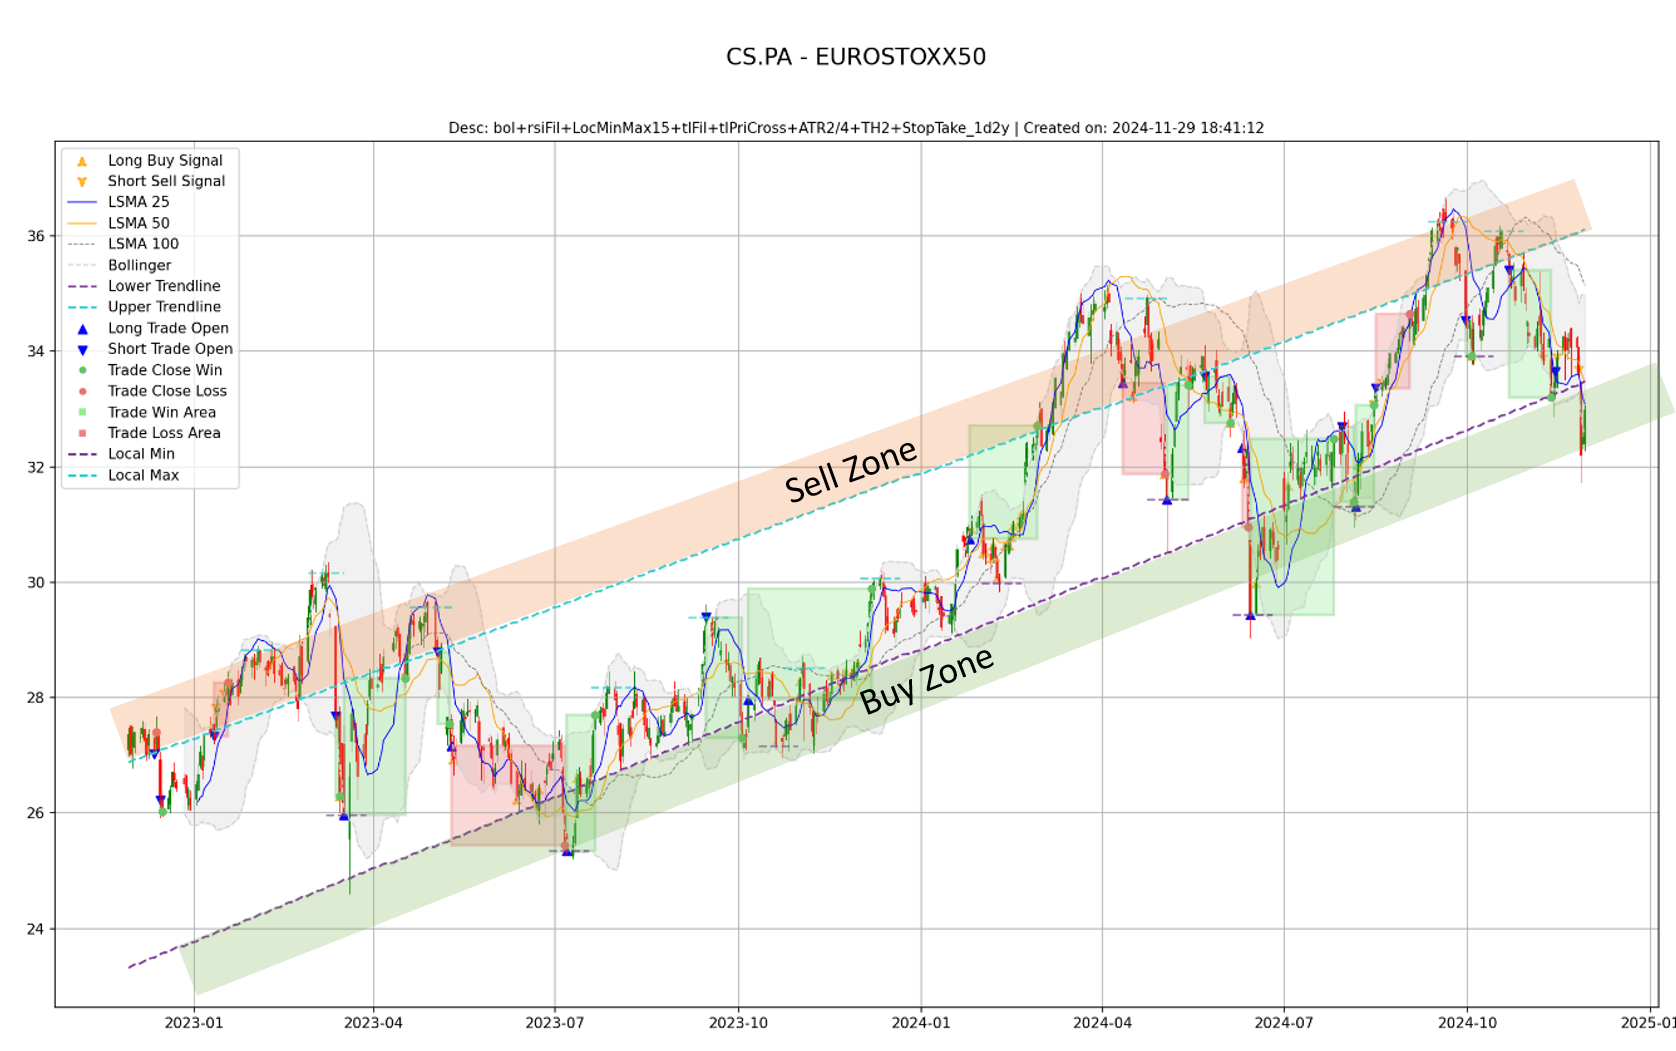
The chart above highlights the following:
- Bollinger Bands: These bands provide insight into price volatility, with signals generated when prices touch or move beyond the upper or lower bands.
- Trendlines: A purple upward trendline marks the support area, while a teal dashed line marks resistance. These indicate long-term price direction.
- Buy and Sell Zones: Highlighted in green and orange, these zones represent favorable areas for entering long or short positions, respectively.
Observations
- Buy Zone (Green Area):
- Positioned along the upward trendline (purple), this zone aligns with periods when prices are at or near local lows.
- The lower Bollinger Band often coincides with these points, signaling a potential rebound.
- Traders can initiate long positions here, targeting the next resistance or the upper Bollinger Band.
- Sell Zone (Orange Area):
- Found near the upper trendline (teal dashed), this zone marks periods when prices approach local highs.
- Prices often touch or exceed the upper Bollinger Band here, indicating overbought conditions.
- Traders can open short positions in this zone, aiming for a correction or return to the lower trendline.
Trading Strategy Recommendations
Short-Term Strategy: Bollinger Bands
Bollinger Bands are used for identifying quick trades:
- Buy Signal: When the price touches or dips below the lower Bollinger Band, especially near a local minimum. This suggests oversold conditions and a potential rebound.
- Sell Signal: When the price touches or exceeds the upper Bollinger Band, particularly near a local maximum. This indicates overbought conditions and a likely pullback.
Example: In the chart, trades marked with green “Trade Win Areas” demonstrate successful trades triggered by Bollinger Band signals.
Mid/Long-Term Strategy: Trendlines
Trendlines offer a broader perspective for strategic positioning:
- Entry Points: Look for prices near the upward trendline. The closer the price is to the trendline, the safer the entry for a long trade, as this area typically acts as strong support.
- Exit Points: Prices nearing the upper resistance trendline are potential exit points for long trades or entry points for short trades. Over time, the resistance serves as a natural ceiling for price growth.
Recommendations for AXA Stock
- Entry Zones:
- Buy: Between €24 and €26, as shown in the Buy Zone, aligning with the lower trendline and lower Bollinger Band.
- Short: Near €36, when the price approaches the Sell Zone at the upper trendline.
- Exit Zones:
- Long Positions: Take profit near €34 to €36, as the price approaches the upper resistance zone.
- Short Positions: Close the position near €28 to €30, where the price is likely to bounce off the lower support.
- Risk Management:
- Use stop-loss orders below the lower trendline for long trades to limit potential losses.
- Place stop-losses above the upper resistance for short trades to mitigate risks.
Conclusion
The analysis of AXA’s stock chart reveals clear opportunities for both short-term and long-term traders. By combining Bollinger Bands and trendline analysis, traders can identify high-probability buy and sell zones. The short-term strategy is ideal for those seeking quick trades based on price volatility, while the trendline strategy provides a solid foundation for longer-term positions.
By adhering to these strategies and managing risks appropriately, traders can maximize their returns while minimizing potential losses.
Disclaimer: This post is for informational purposes only and should not be taken as financial advice. Always perform your own due diligence before making investment decisions.
Leave a Reply