Platinum is a highly traded commodity known for its volatility and cyclical price movements. By combining short-term Bollinger Bands with medium-to-long-term trendlines, traders can better identify profitable entry and exit points. In this analysis, we’ll break down the provided chart (see above) to highlight key trading opportunities for Platinum.
1. Chart Overview: Key Components
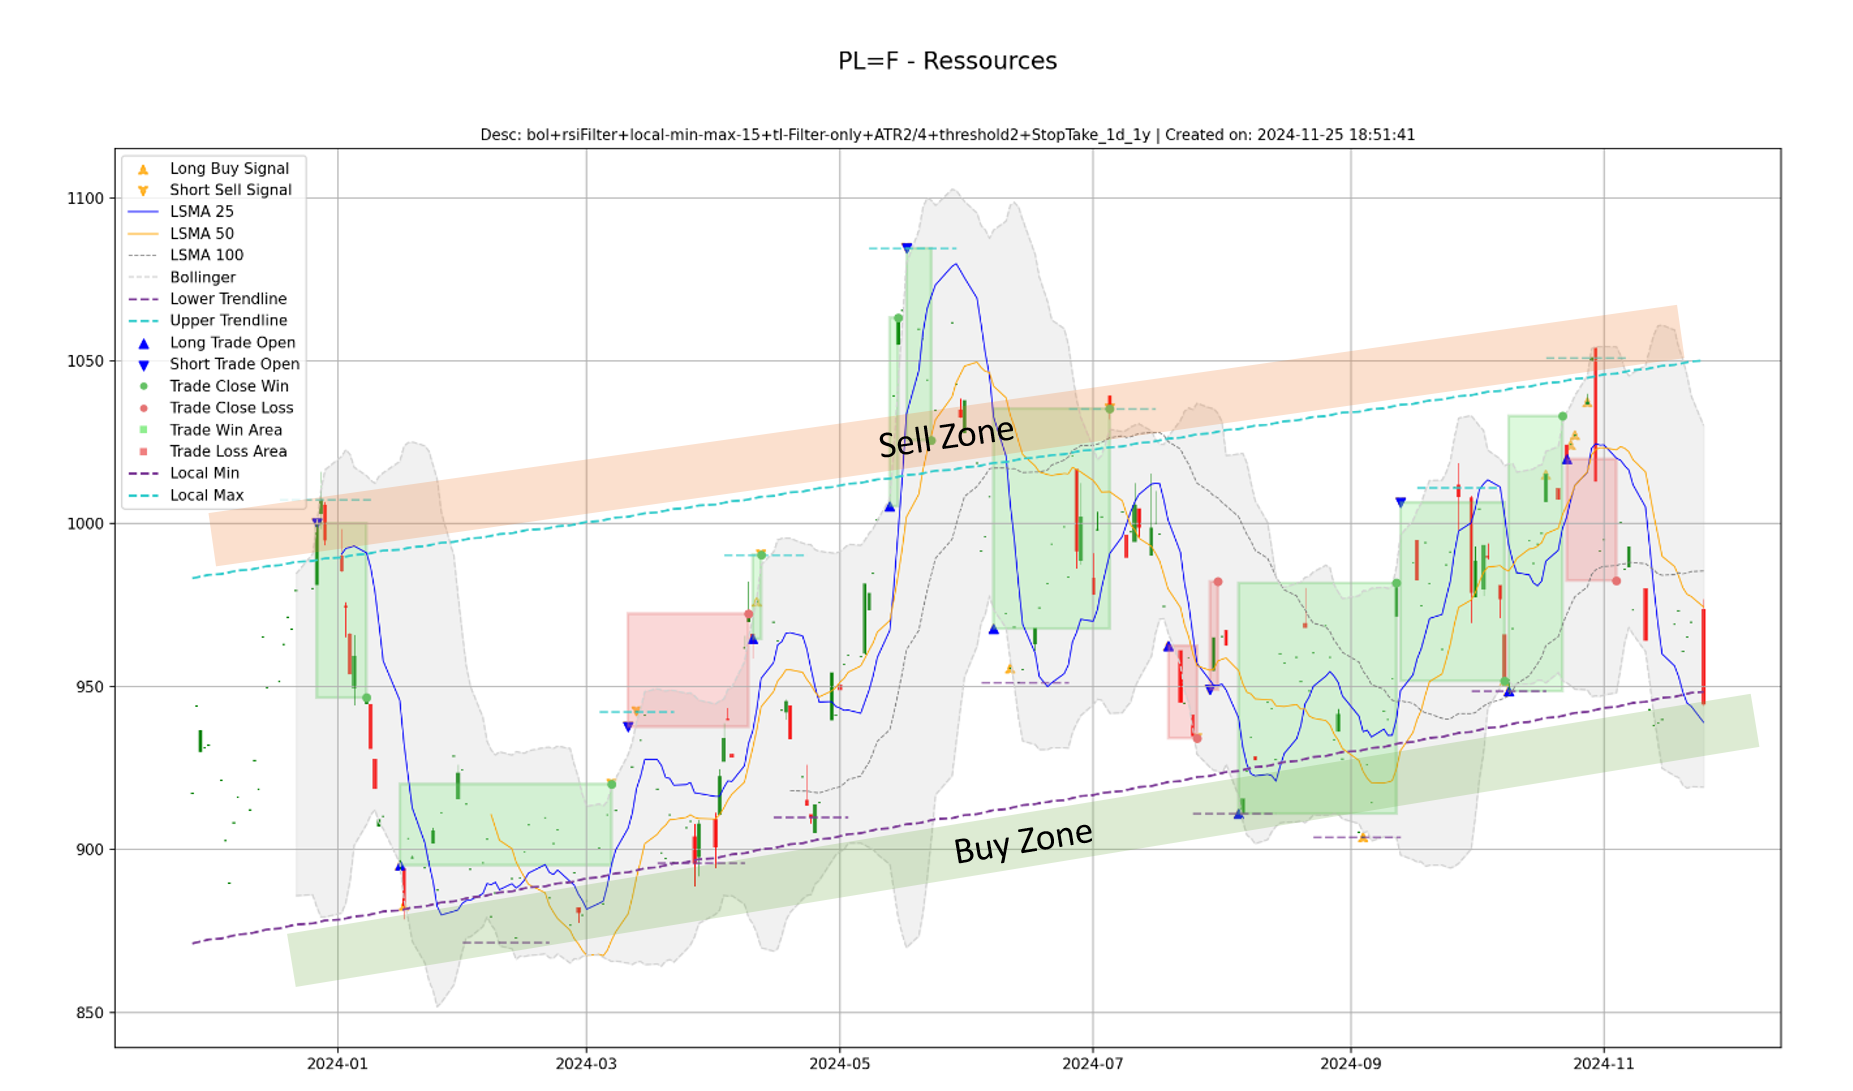
The chart analysis for Platinum includes:
- Bollinger Bands (blue lines): Short-term indicators of price volatility and overbought/oversold conditions.
- Trendlines:
- Support Trendline (purple): Indicates long-term price support zones for buy opportunities.
- Resistance Trendline (orange): Marks upper resistance zones for potential sell signals.
- Local Minima/Maxima: Key reversal points that often coincide with trade signals.
- Trade Signals: Highlighted with triangles for long/short entry points and marked areas of profit (green) or loss (red).
This combination provides a comprehensive view of short-term price action within a broader market trend.
2. Short-Term Strategy: Bollinger Bands
Bollinger Bands are invaluable for identifying short-term trading opportunities in Platinum:
- Buy Zone: Prices near the lower Bollinger Band represent oversold conditions. Historically, Platinum tends to bounce from this level, as seen in early 2024, where trades aligned with the lower band led to long positions.
- Sell Zone: The upper Bollinger Band highlights overbought conditions. In mid-2024, Platinum approached the upper band in the Sell Zone, offering ideal points to exit long positions or initiate shorts.
3. Medium/Long-Term Strategy: Trendlines
For Platinum, trendlines add an extra layer of strategic insight:
- Support Trendline (purple): This long-term upward trendline signals strong buy opportunities when prices approach or touch it. Notable examples include early 2024 and late 2024, where prices in the Buy Zone aligned with the support trendline.
- Resistance Trendline (orange): The upper trendline marks sell or short zones, as seen in mid-2024, where prices reversed near this resistance level.
By using these trendlines, traders can confirm Bollinger Band signals and refine their trading strategies.
4. Backtested Trade Performance
The chart includes past trade signals and outcomes, offering insights into the effectiveness of this strategy:
- Winning Trades (green zones): Highlight profitable trades initiated near the lower Bollinger Band and supported by the trendline. For example, the Buy Zone in March 2024 saw Platinum rally significantly, validating the signal.
- Losing Trades (red zones): Emphasize the importance of managing risk. Breakdowns below the support trendline or Bollinger Band failures can lead to losses, underscoring the need for disciplined stop-loss orders.
5. Strategic Recommendations for Platinum
Based on this analysis:
- Entry Points:
- Use the lower Bollinger Band and support trendline as a confluence zone for initiating long positions.
- Look for local minima to confirm potential reversals.
- Exit Points:
- Take profits near the upper Bollinger Band or resistance trendline.
- Monitor local maxima as additional signals to exit long positions or consider shorts.
- Long vs. Short Strategy:
- Focus on long positions when prices approach the Buy Zone near the support trendline and lower Bollinger Band.
- Short positions are advisable in the Sell Zone, especially near the resistance trendline or after prices fail to hold above the upper Bollinger Band.
6. Conclusion
Platinum trading demands a balance of short-term reactivity and long-term perspective. By integrating Bollinger Bands and trendlines, traders can navigate Platinum’s volatility with greater precision. As always, backtesting and adaptive risk management remain key to optimizing this strategy.
Leave a Reply