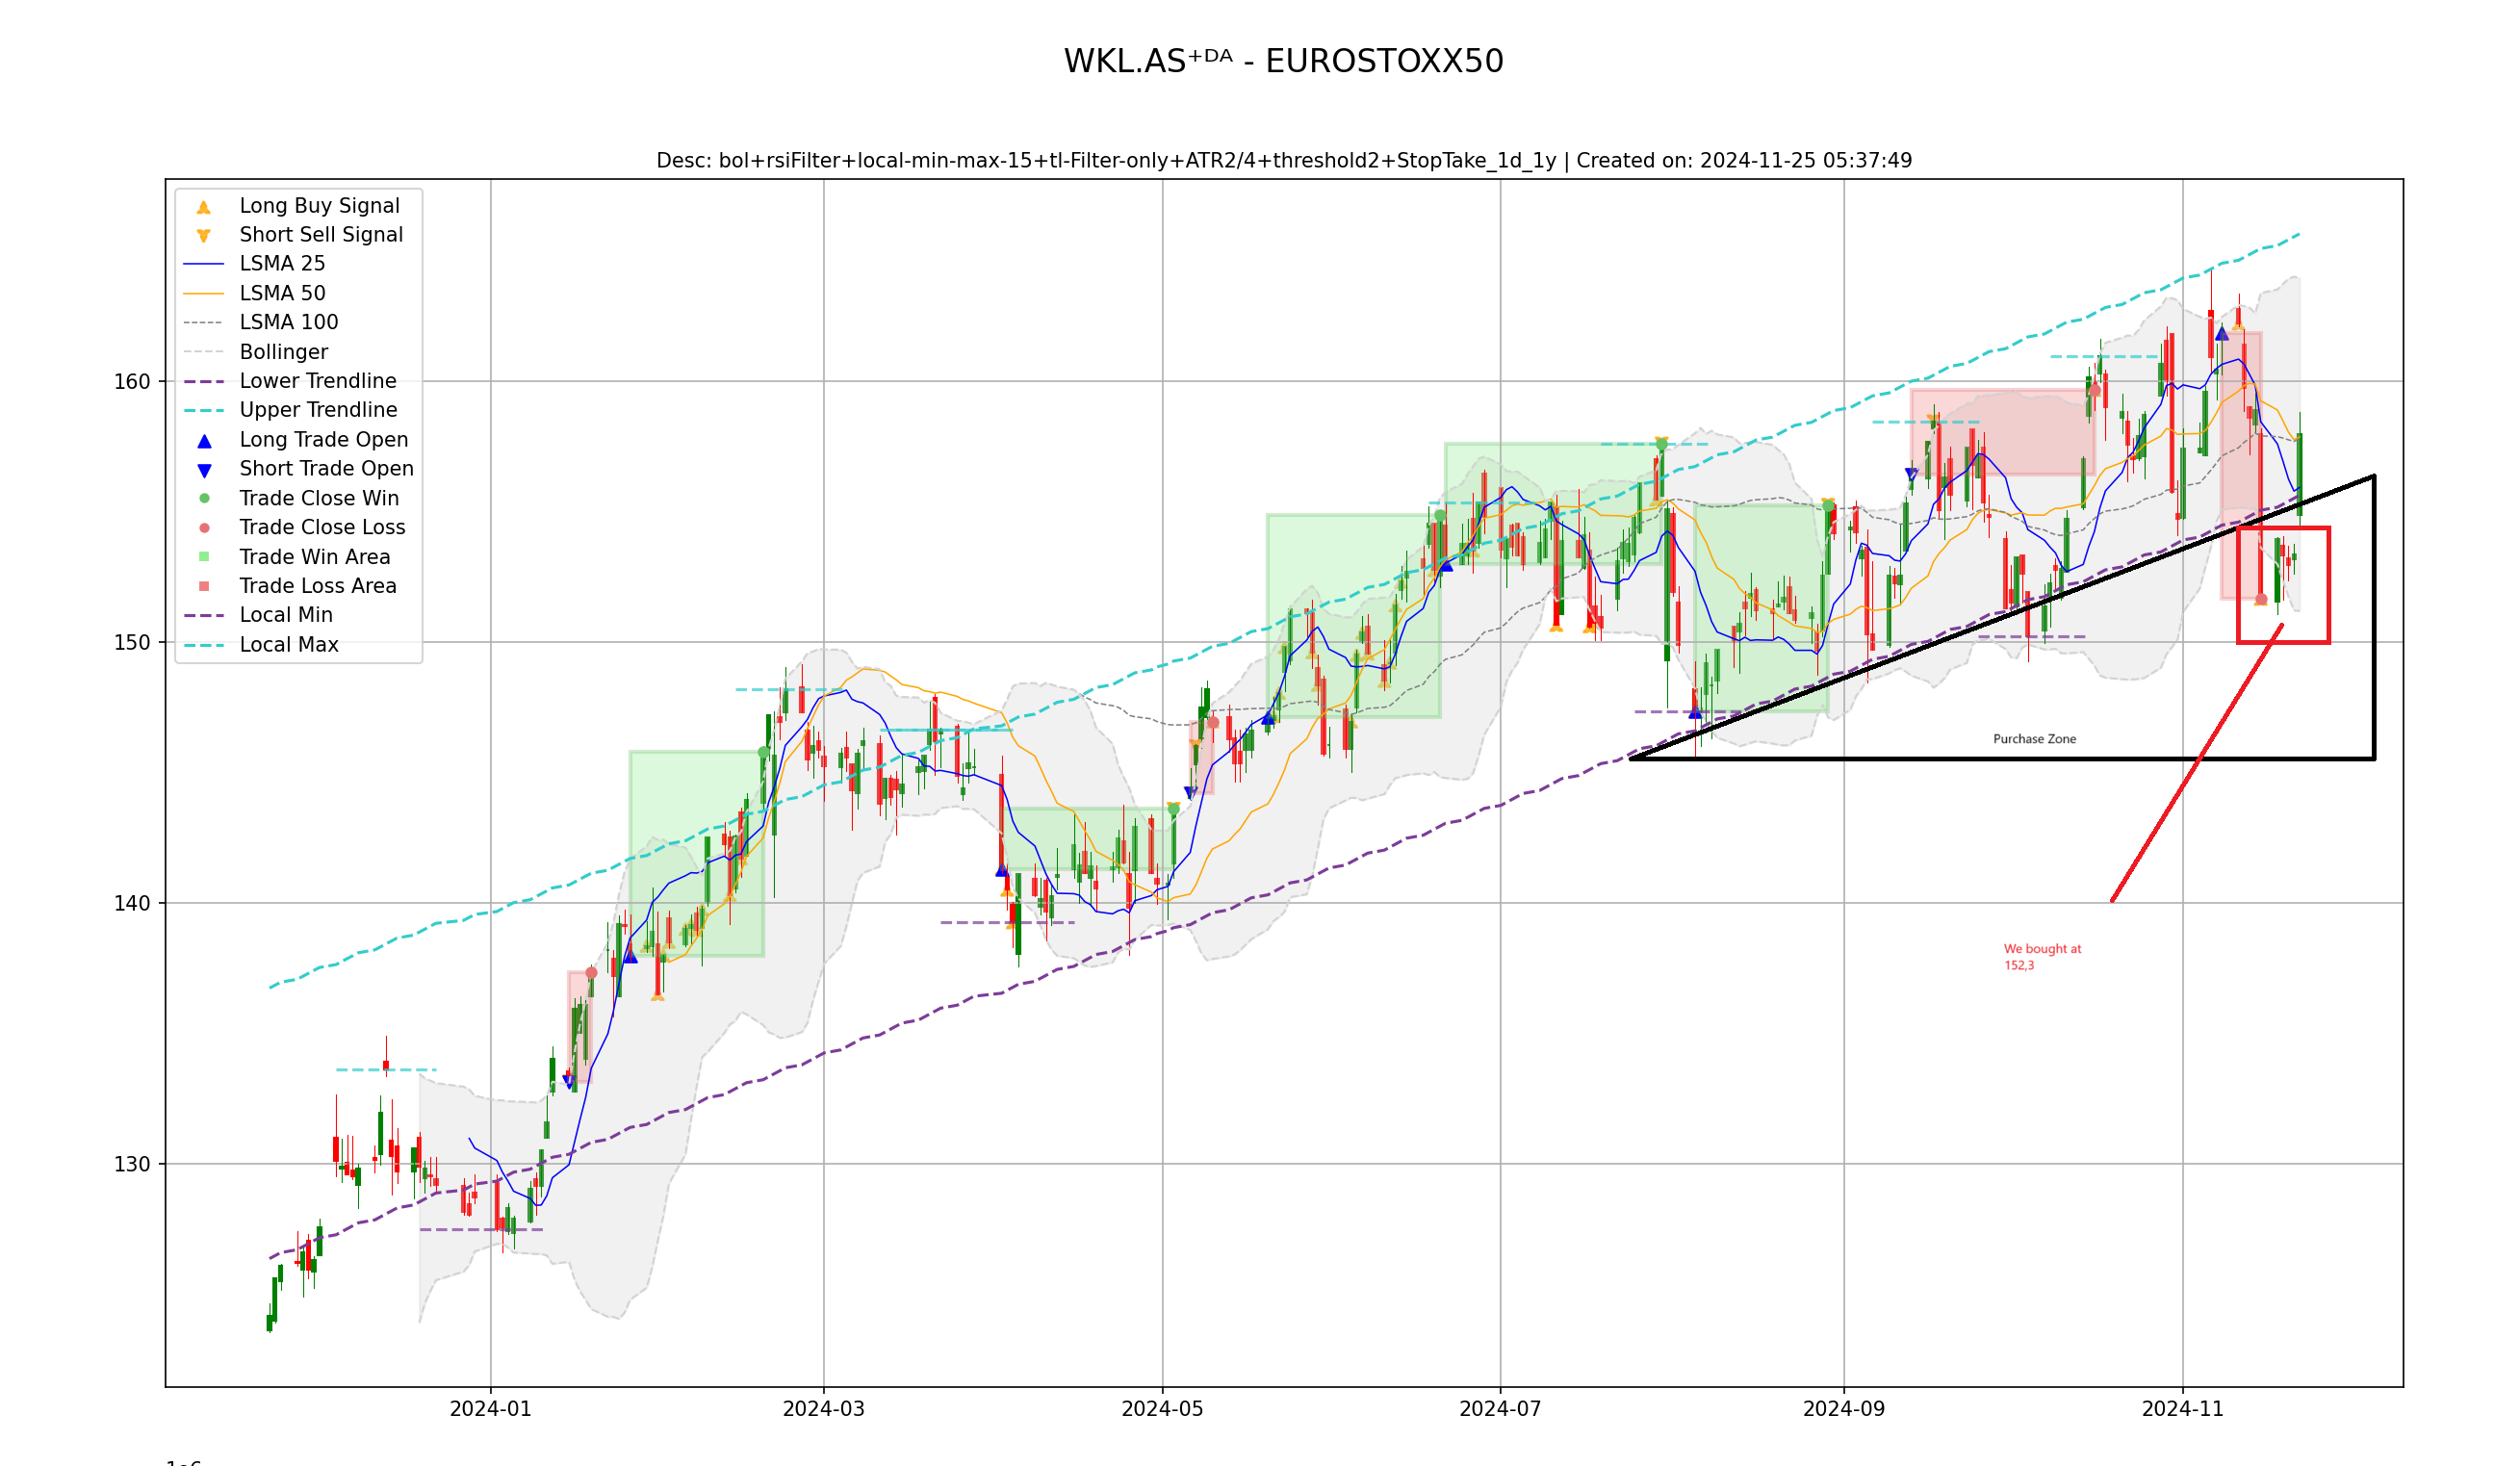
In this analysis, we delve into the technical overview of WOSB (Wolters Kluwer)’s performance based on the provided chart. By examining key indicators, patterns, and strategic zones, we can form a clear narrative about past trends and potential future movements.
1. Key Observations
The chart showcases several critical elements:
- Long-Term Trendline: A one-year upward trendline is visible, marked by an orange line. This indicates a consistent bullish trajectory over the past year, with periodic corrections.
- Bollinger Bands: The inclusion of Bollinger Bands highlights the stock’s volatility. The recent price movement has approached the lower band, signaling potential oversold conditions.
- Support Zone (Purchase Zone): A black triangle has been identified as the “Purchase Zone.” This suggests a strategic buying opportunity where the price may find support and potentially rebound.
2. Current Status
The stock has recently retraced to the “Purchase Zone,” which highlights an area where potential entry points into a long trade are meaningful, with a specific entry at 152.30€, which is the price where we enter the trade. This level is emphasized as a key support, given its position within the defined triangle pattern and proximity to the lower Bollinger Band.
3. Analysis of Indicators
- Trendline Respect: The stock has consistently respected the one-year trendline. This provides confidence that the bullish momentum could persist unless there is a significant breakdown below this level.
- Bollinger Band Signals: The stock touching the lower Bollinger Band could indicate an impending reversal. Historically, such interactions often precede upward momentum.
4. Potential Scenarios
Bullish Scenario:
- If the stock maintains its position within the “Purchase Zone” and respects the trendline, a bounce-back towards higher resistance levels can be anticipated.
Bearish Scenario:
- A decisive breakdown below the “Purchase Zone” and the one-year trendline would invalidate the bullish setup. In such a case, further downside correction could follow.
6. Conclusion
This chart reflects a disciplined approach to stock trading. By combining technical indicators, strategic zones, and pattern analysis, we can make informed decisions. The purchase at 152.30€ aligns with a logical support area, and the broader context suggests potential upside.
Investors should, however, remain vigilant and adapt their strategies based on evolving price action and market conditions. Combining this technical framework with fundamental analysis will further enhance decision-making.

Leave a Reply