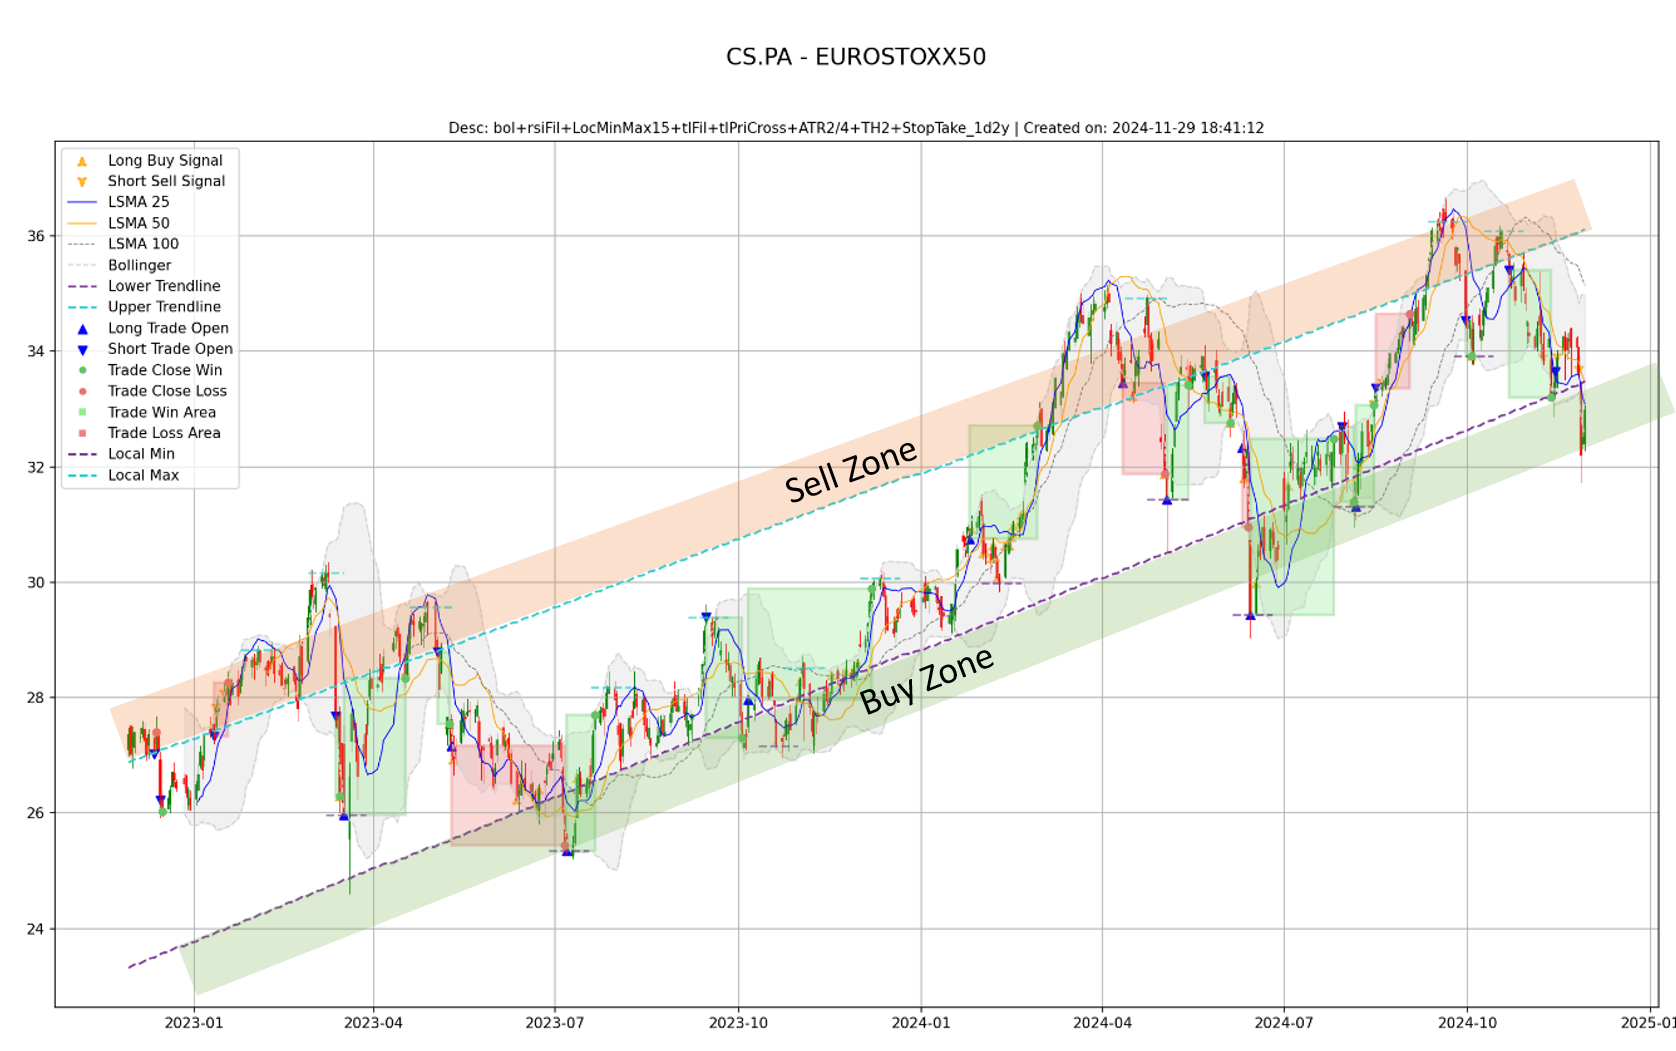
In this post, we will analyze AXA’s stock chart to derive actionable trading strategies based on technical indicators such as Bollinger Bands, local maxima and minima, and trendlines. These tools help identify optimal entry and exit points for both short-term and long-term trading strategies. By understanding the dynamics of the chart, traders can navigate buy and sell zones with greater confidence.
The analysis divides strategies into:
- Short-term trades using Bollinger Bands for quick buy/sell signals.
- Mid/long-term trades using trendlines for more gradual entry/exit points.